What is COSMOS?
The CERN Accelerator Control System relies on many components and a substantial infrastructure, which must be available 24 hours a day, 7 days a week. This hardware and software infrastructure needs to be monitored in order to anticipate or detect failures and fix them as quickly as possible. In 2019, about 7000 hosts, 30000 services and 150000 metrics are monitored by COSMOS.
How it works?
At the heart of the COSMOS system, one finds an open-source product called Icinga2. Icinga covers most of controls monitoring needs out of the box and perfectly fits the collaborative and distributed model that we need to monitor our heterogeneous infrastructure (from the hardware, software and human point of view). In parallel, COSMOS uses collectd agents to gather system metrics from hosts, related devices (disks, memory, etc.) and the network. collectd makes this information available over the network to the central server, where data is stored into the InfluxDB database. Whenever it is not possible to compute the status of a service from a single Icinga2 check, or in order to detect trends, COSMOS uses Prometheus as an intermediate agent.
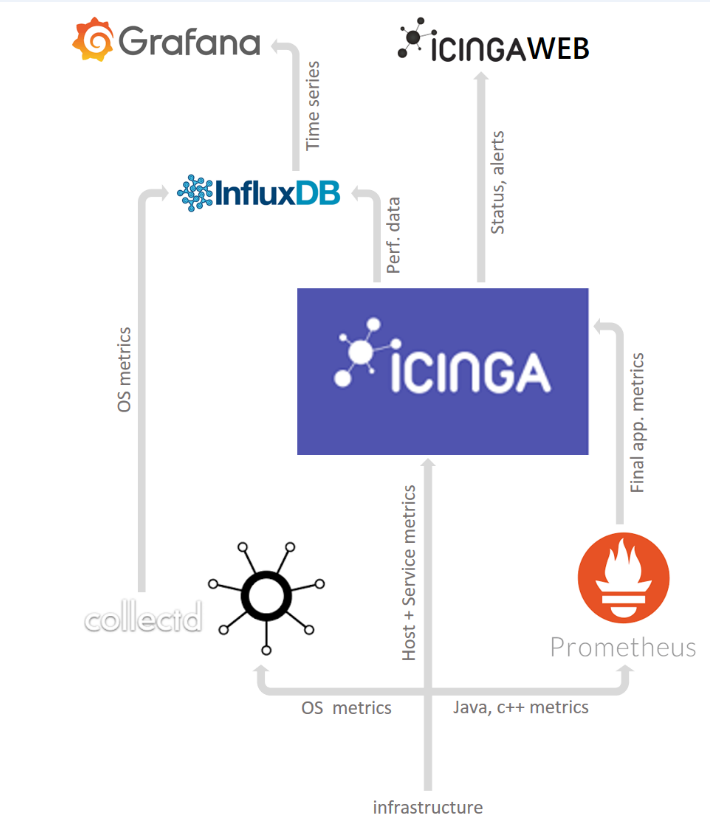
The central Icinga database is used by expert tools such as IcingaWeb, to establish, in real time, a complete diagnostic of each component, to manage notifications and downtime, and to provide detailed statistics and event histories. It is very efficient at providing an overview of problems occurring in the infrastructure, as well as a detailed history of events. In addition to its powerful search tool and its integrated and customizable views, IcingaWeb offers a complete, multi-user interface to interact with the monitoring process (events control, downtime period, checks scheduler, etc.).
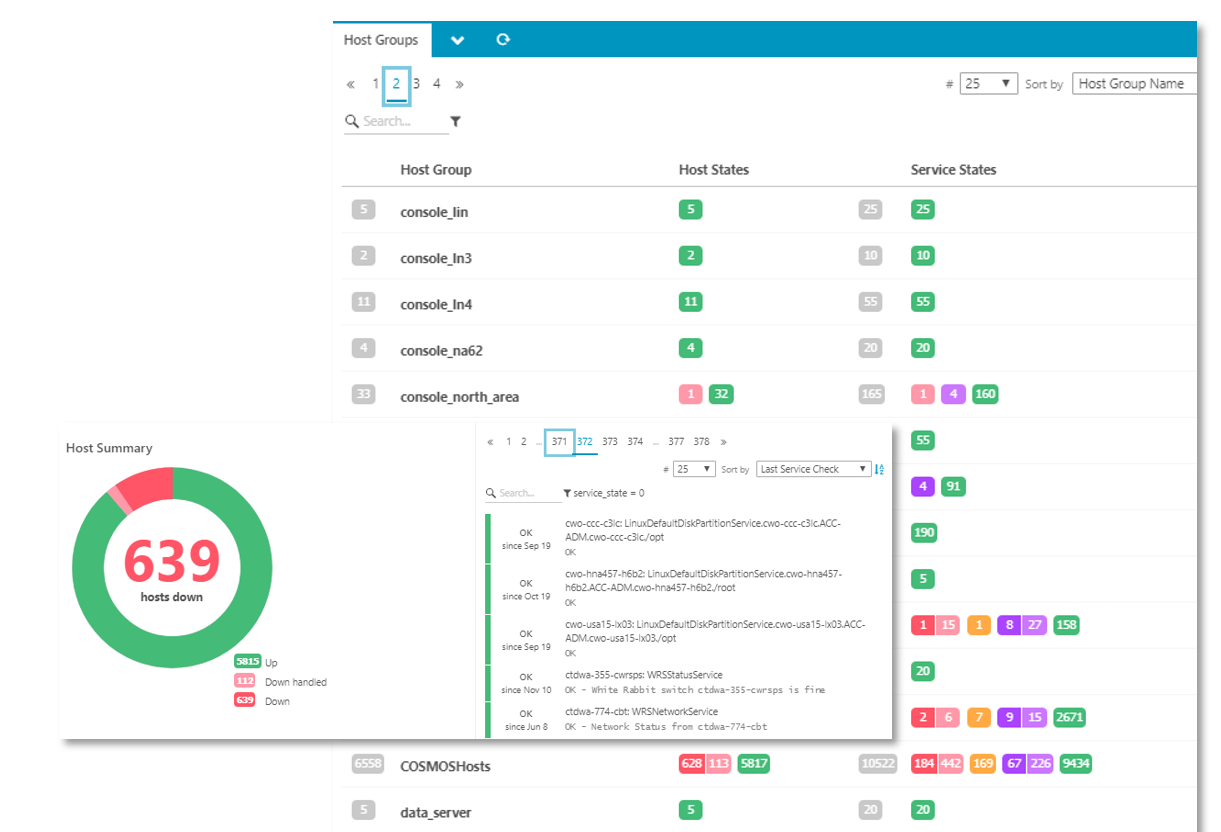
IcingaWeb: https://cosmosprod.cern.ch/
Finally, data can be visualized and analyzed by expert users thanks to a dedicated Grafana instance.
Grafana is the main entry point for visualizing infrastructure metrics. As collectd ingests data and sends it to the Influx database, Grafana is used to query and display results in graphical manner. Teams can create their own dashboards, focusing on particular aspects of the infrastructure.
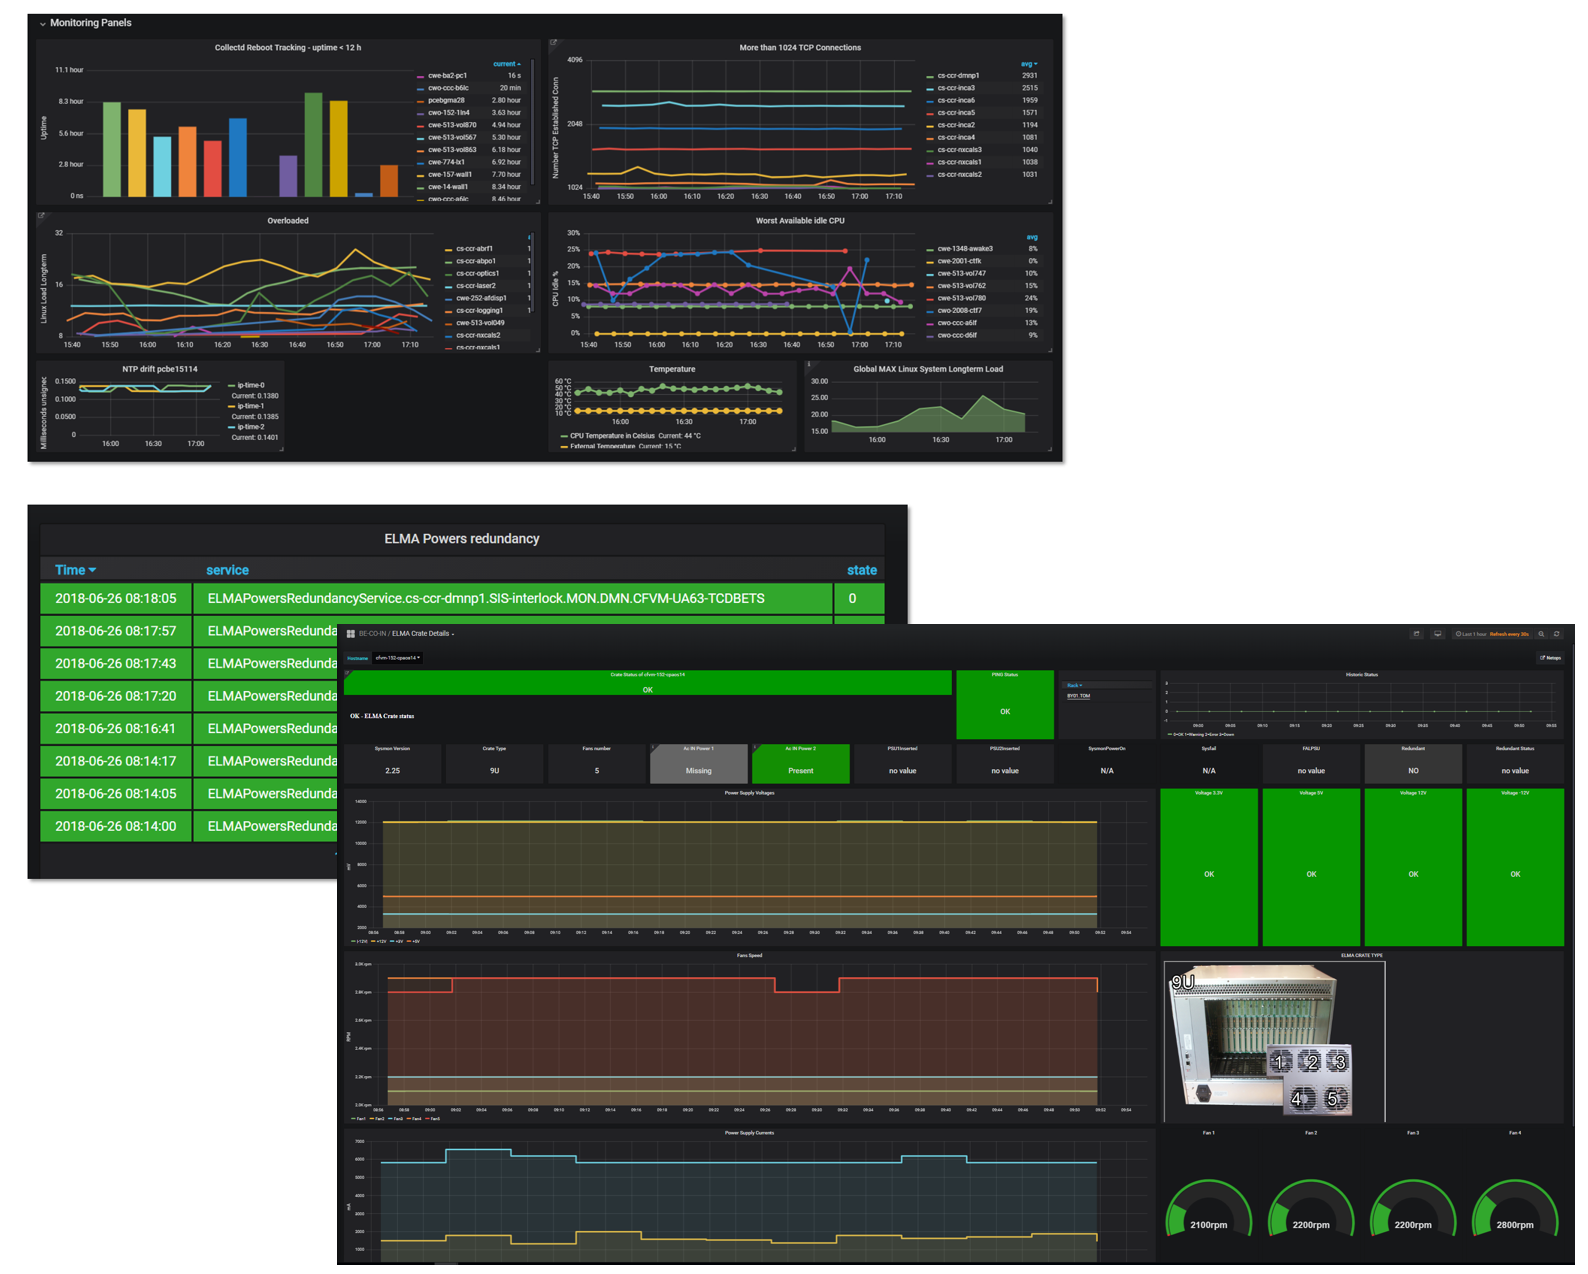
Grafana: https://cosmos-grafana.cern.ch/